A service website can appear fully loaded and still feel unresponsive when a visitor opens the mobile menu, changes a form option or presses a booking button. Interaction to Next Paint, or INP, measures the delay between a qualifying user interaction and the next frame the browser presents. A useful service website INP audit therefore follows the customer journey after loading, not only the first impression of the page. The work begins with field evidence, continues with a repeatable laboratory test and ends with a targeted fix that preserves the intended function. This guide explains how marketing and development teams can choose important interactions, interpret the current INP thresholds, separate input, processing and presentation delays, control third-party code and turn the result into a practical release check.
Understand what INP measures before testing
INP evaluates responsiveness across click, tap and keyboard interactions during a page visit. It is not a timer for every effect that eventually follows an action. The measurement ends when the browser can present the next frame showing visual feedback. That distinction matters for service journeys. A request may take time to reach a server, but the interface can still acknowledge the press promptly, show a clear progress state and avoid leaving the visitor wondering whether anything happened. Scrolling and hovering are not qualifying INP interactions, although a click associated with a control is.
Google's web.dev guidance currently classifies an INP at or below 200 milliseconds as good, above 200 and at or below 500 milliseconds as needing improvement, and above 500 milliseconds as poor. The recommended assessment uses the 75th percentile of page visits, separated for mobile and desktop. Treat those values as a shared diagnostic language rather than a promise of revenue or rankings. A page may respond quickly while presenting a confusing offer, and a useful page may still need technical work. Performance and clarity should be reviewed together.
Choose the service interactions that matter
Create a short journey inventory before opening a performance tool. Include the mobile navigation, service filters, accordions, language controls, contact form fields, validation messages, chat launcher and primary enquiry button where they exist. Record the user goal and the expected visual response for each action. Do not manufacture interactions merely to create a longer test list. The priority is a representative set of tasks that help a visitor understand the service, confirm suitability or contact the team.
Test at moments when the page is realistically busy. A visitor may open the menu before every script has finished evaluating, select a form option after a third-party widget appears or return to a tab after leaving it idle. web.dev recommends reproducing common interactions during loading because the main thread may be busiest then. Include a mid-range phone or an appropriate device simulation when mobile visitors matter. Record the route, device context, consent state and sequence of actions so another reviewer can repeat the same journey.
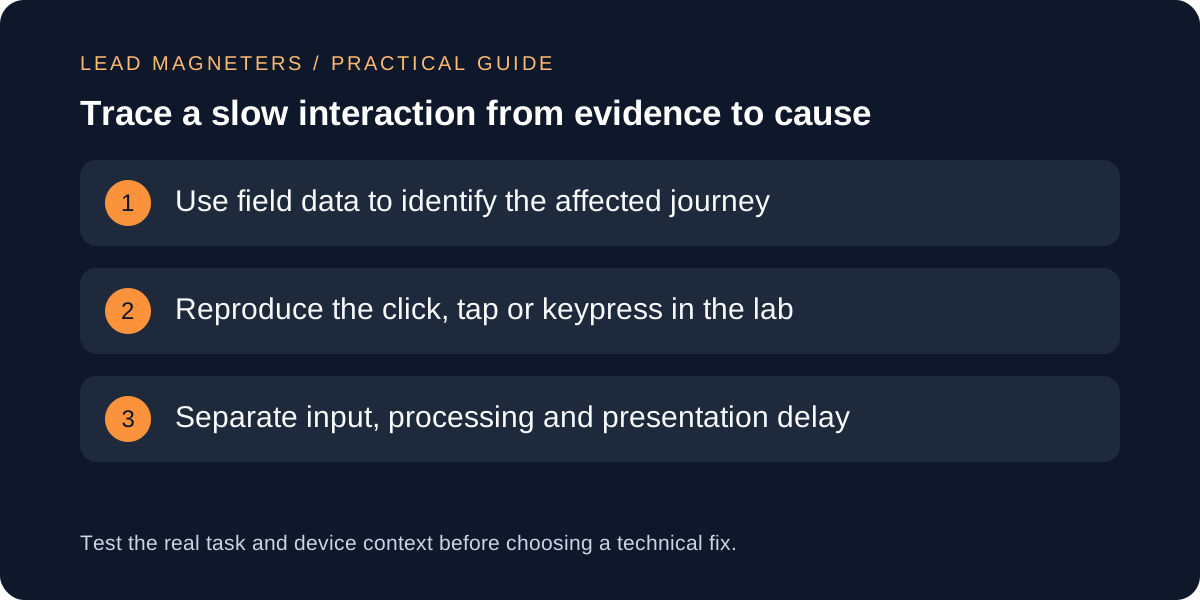
Start with field evidence, then reproduce the delay
Field data describes what actual visitors experienced across different devices and conditions. Chrome User Experience Report data can show whether a page or origin has enough eligible observations, while a real-user monitoring setup can provide more specific context when it is implemented responsibly. A new or low-traffic service page may have no page-level INP value. That absence does not prove the page is fast. It may mean there were too few qualifying interactions or visits for a meaningful report, so document the limitation instead of replacing it with a confident conclusion.
Use field evidence to choose a journey, then reproduce it in a laboratory environment. The laboratory run is for diagnosis: interact with the same control, inspect the performance trace and repeat until the delay is understandable. It does not become the site's field INP simply because the tool displays a response time. Keep screenshots or trace references with the route and test conditions, but avoid collecting customer information. If the problem cannot be reproduced, compare device capability, page state, cached assets and third-party activity before changing code based on guesswork.
Set a broader performance budget →
Separate the three parts of a slow interaction
A qualifying interaction can be divided into input delay, processing duration and presentation delay. Input delay is the wait before the event callbacks begin, often because other work occupies the main thread. Processing duration covers the work performed by the callbacks. Presentation delay is the wait until the browser can render and paint the visual result. Identifying the largest part prevents a team from applying the same optimisation to every problem. A slow menu may be waiting behind unrelated script evaluation, doing too much work in its own handler or triggering an expensive layout update.
Look for long tasks, large script evaluation blocks, repeated style calculations and rendering work associated with the tested action. Then connect the trace to the actual code or third-party feature. Keep the fix proportionate. Break up unnecessary long work, defer non-critical tasks, reduce the scope of interface updates and provide immediate visual feedback where appropriate. Do not remove a required accessibility behaviour or submission safeguard solely to make a trace shorter. The interaction must remain understandable with a keyboard, touch input and assistive technology.
Review third-party code and component boundaries
Service websites often load analytics, advertising tags, chat tools, booking widgets, consent managers and embedded media. Each addition may have a valid purpose, but its script evaluation or event handling can compete with the interface for main-thread time. Build an inventory that names the owner, business purpose, loading condition and affected routes. Test an interaction with and without an optional integration in a controlled environment. The comparison helps establish evidence, but do not disable consent or security controls on the public site to obtain a better score.
Also inspect how the site's own components update. A small button press should not require an unrelated page region to perform expensive work. Keep state close to the component that needs it, avoid unnecessary re-rendering and delay non-urgent follow-up work until after useful feedback has appeared. Static rendering helps initial delivery, but client-side behaviour still needs review when the visitor interacts. Prefer a focused code change over adding a heavy performance library whose monitoring overhead and maintenance cost are not understood.
Verify the fix and make it part of releases
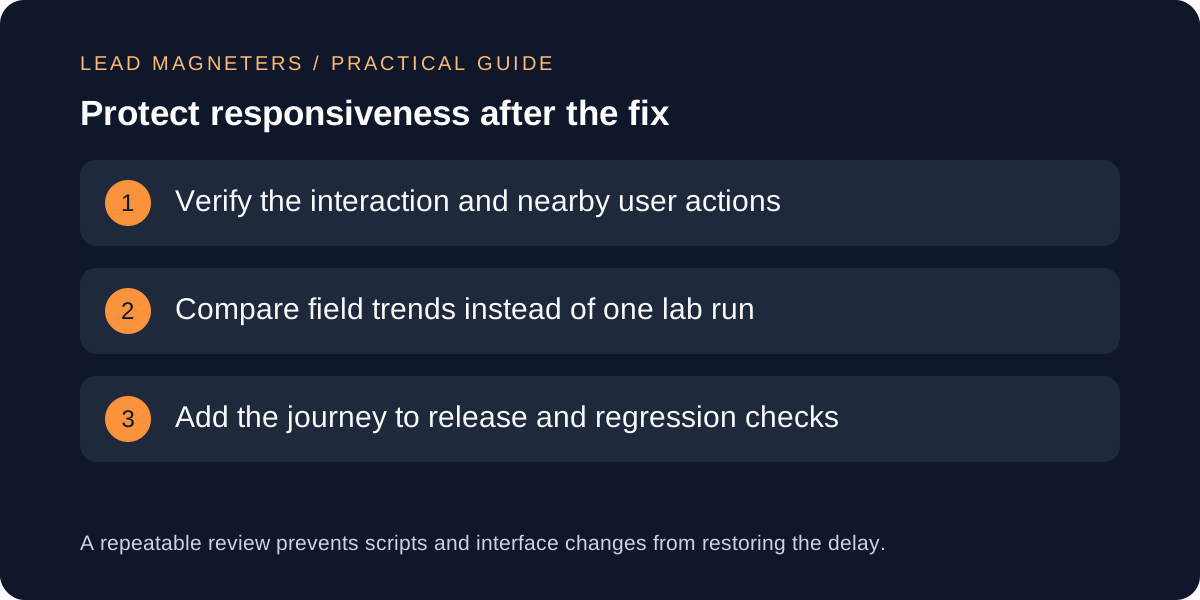
Repeat the original journey after the change and inspect nearby actions for regressions. Confirm that the menu still exposes the correct links, form errors remain useful and the enquiry action is submitted once. Compare like with like: the same route, device conditions, page state and interaction sequence. A single fast laboratory run is evidence that the problem can be improved under those conditions, not proof that every visitor now receives a good field experience. Monitor the field trend after release and note when sufficient new data becomes available.
Add the important journey to the site's release checklist. Record the responsible owner, test route, expected feedback and the conditions that previously exposed the delay. Review the list when a marketing tool, form provider, navigation component or consent configuration changes. For a web development consultation, bring the field report, repeatable interaction steps and any trace that identifies the delayed work. This allows the discussion to focus on the visitor's task and the smallest reliable fix, while keeping speed, accessibility and conversion flow connected.